
Why your industrial data are unusable and how to put them back in order with Python
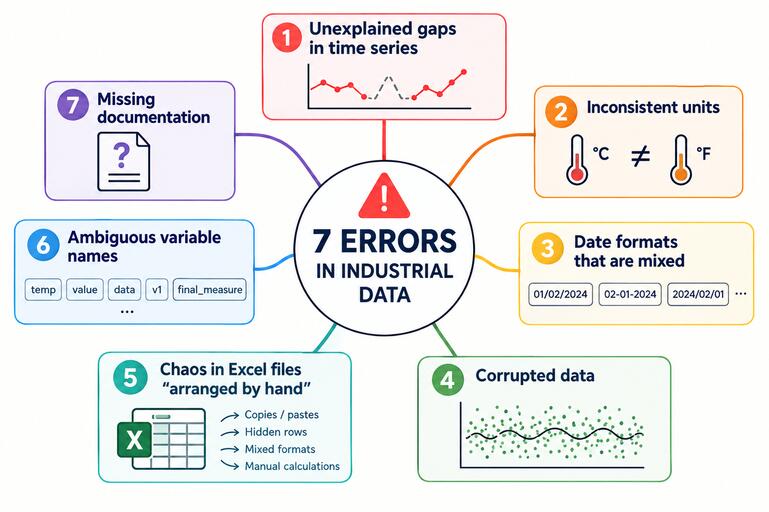
In an aeronautical predictive maintenance project, the goal was to predict filter clogging based on current consumption measurements. The idea was simple: as the filter becomes clogged, the pump compensates by consuming more power. By monitoring this consumption, it should be possible to anticipate filter replacement before a failure occurs.
In theory, it’s elegant.
In practice, we opened the data and discovered something inexplicable: series that would stop abruptly for several months without any trace of filter changes in the maintenance logs. Then they would resume, sometimes from where they had left off, sometimes from a “clean” state, as if the filter had just been replaced without anyone notifying us.
It was impossible to know if it was a faulty sensor, a transmission problem, a filter changed during maintenance, or something else. The data was there but it was unusable.
This project taught me something I wish I had known much earlier: in industry, the problem is almost never the algorithm. It’s the data.
Why the industrial data are in this state
Before trying to fix it, we must understand why this problem is so widespread.
The answer lies in one sentence : the industrial data have been designed to be read by humans not processed by machines.
A technician opening an Excel file sees attractive formatting—colored cells, bold totals, well-presented pivot tables. He intuitively understands what he sees. Python, however, understands none of this. It sees merged cells that it cannot parse, numbers stored as text that it cannot add up, and dates in English format on a system configured in French.
There is also a second reason is less obvious : no one anticipated that these data would one day be analyzed automatically. The technician who designed the track sheet in 2015 did not know that in 2024 someone would like to extract trends with Python. He did what was sense for him : a clear presentation to his colleagues not a structure that can be used by an algorithm.
The result is that in most of the industrial projects 60% to 80% of the time is spent preparing the data and only 20% to 40% to really analyze it.
The 5 families of problems and how to fix them
Problem 1 — The missing data and unexplained behaviors
This is the most insidious problem because it doesn’t generate any visible error. Your script runs, it produces a result but that result is wrong because it has been calculated on incomplete data.
Regarding the filter project I mentioned in the introduction, gaps of several months in the production runs completely skewed our degradation models. We were calculating a fouling rate on series that had unexplained “jumps”.
Missing data take several forms: gaps in time series where the series stop and resume without explanation, NaN or null values where the line exists but the value is empty and outliers that have no physical meaning.
How to detect and quantify :
import pandas as pd
import numpy as np

df = pd.read_csv('donnees_capteurs.csv', sep=';', parse_dates=['timestamp'])
df = df.sort_values('timestamp').reset_index(drop=True)

# Valeurs manquantes par colonne
taux_manquants = df.isnull().sum() / len(df) * 100
print("Taux de valeurs manquantes :")
print(taux_manquants[taux_manquants > 0].round(1))

# Trous dans la série temporelle
df['delta_t'] = df['timestamp'].diff()
frequence_normale = pd.Timedelta('1min')  # à adapter
seuil_trou = frequence_normale * 5        # tolérance : 5x la fréquence

trous = df[df['delta_t'] > seuil_trou][['timestamp', 'delta_t']]
print(f"nNombre de trous détectés : {len(trous)}")
print(f"Durée totale manquante   : {trous['delta_t'].sum()}")
print(trous)

# Codes d'erreur déguisés en valeurs — remplacer par NaN
VALEUR_MIN = 0      # à adapter selon votre capteur
VALEUR_MAX = 1000   # à adapter selon votre capteur

df['valeur'] = df['valeur'].where(
    df['valeur'].between(VALEUR_MIN, VALEUR_MAX), other=np.nan
)
How to fix :
# Option 1 : interpolation linéaire (trous courts)
df['valeur_interpolee'] = df['valeur'].interpolate(method='linear')

# Option 2 : exclure les séquences avec trous longs
# Ne jamais inventer des données sur plusieurs mois
df_propre = df[df['delta_t'] <= seuil_trou].copy()

# Option 3 : signaler le trou sans l'interpoler
df['donnee_fiable'] = df['delta_t'] <= seuil_trou
The key rule to remember: a gap of several months cannot simply be filled in. You exclude it, document it, and seek to understand why it exists before proceeding further.
Problem 2 — Formats that break everything during import
This is the error that causes the most daily frustration. You open a file, run your script, and get incomprehensible error messages or worse, silently incorrect calculations.
The usual suspects are almost always the same. Dates stored as text: Excel displays “15/03/2024,” but the cell actually contains a text string and pandas cannot calculate duration from text. Date formats that vary by system: a file created on an English-language system (MM/DD/YYYY) and opened on a French one (DD/MM/YYYY) where 03/05/2024 becomes March 5th instead of May 3rd, without triggering any Python errors. Inconsistent decimal separators: some files use commas (French format), others use periods (English format) and sometimes both appear in the same file.
import pandas as pd

df = pd.read_csv('mesures.csv', sep=';')

# Diagnostic rapide des types
print("Types détectés par pandas :")
print(df.dtypes)
# Si une colonne numérique est en 'object' → problème de format

# Corriger les dates — toujours spécifier le format explicitement
df['date'] = pd.to_datetime(df['date'],
                             format='%d/%m/%Y',
                             errors='coerce')

# errors='coerce' → les dates non parsables deviennent NaT
print(f"Dates non parsées : {df['date'].isna().sum()}")

# Corriger les nombres mal formatés
df['mesure'] = (df['mesure']
    .astype(str)
    .str.replace(' ',   '', regex=False)   # espaces (séparateur milliers)
    .str.replace('xa0','', regex=False)   # espace insécable (fréquent Excel)
    .str.replace(',',  '.', regex=False)   # virgule → point décimal
    .pipe(pd.to_numeric, errors='coerce'))

print(f"nAprès correction :")
print(df.dtypes)
print(df.isnull().sum())
The rule to remember : always explicitly specify the date format and decimal separator in your code. Never rely on pandas’ automatic parsing for industrial data.
Problem 3 — The chaos of the Excel files
Pivot tables used as data sources their structure is human-readable but unreadable for Python. Cells containing invisible line breaks, the value looks normal in Excel but Python sees “reference\n” instead of “reference.” Data scattered across multiple tabs with no documented logic. And above all: numbers entered using dots instead of commas, or commas instead of dots, depending on each operator’s habits.
import pandas as pd

# Lire un fichier Excel en évitant les pièges classiques
df = pd.read_excel(
    'donnees_production.xlsx',
    sheet_name='Mesures',  # toujours nommer l'onglet explicitement
    header=0,
)

# Nettoyer toutes les colonnes texte en une seule passe
cols_texte = df.select_dtypes(include='object').columns

for col in cols_texte:
    df[col] = (df[col]
        .astype(str)
        .str.strip()                           # espaces début/fin
        .str.replace('n', ' ', regex=False)   # retours à la ligne
        .str.replace('r', '',  regex=False)   # retours chariot
        .str.replace('xa0', '', regex=False)  # espaces insécables
        .replace('nan', pd.NA))                # 'nan' texte → vraie valeur manquante

# Supprimer les lignes et colonnes totalement vides
df = df.dropna(how='all').dropna(axis=1, how='all')

# Supprimer les doublons
df = df.drop_duplicates()

print(f"Dataset après nettoyage : {df.shape}")
print(df.head())
The rule to remember : an Excel file intended for automated processing must adhere to a simple rule: one row per observation, one column per variable, no merged cells, no subtotals, and no formatting that conveys meaning.
Problem 4 — Inconsistent units and variable names
Two files, two temperature sensors, two different engineers. One exported in °C, the other in °F. Both columns are named “temperature”. No Python error, just incorrect results that look perfectly normal.
This problem is compounded in the industry by the long duration of projects. A system installed in 2010 uses one naming convention; a second one, installed in 2018, uses another. Five years later, someone has to get the two systems communicating and no one remembers who decided what.
import pandas as pd

df = pd.read_csv('capteurs.csv', sep=';')

# Audit des plages de valeurs
# Une température moteur en °C : entre 0 et 900
# En °F : entre 32 et 1650 — immédiatement suspect
print("Plages de valeurs par colonne :")
print(df.describe().loc[['min', 'max', 'mean']].round(1))

# Standardiser les noms de colonnes
# Convention : [grandeur]_[source]_[unité]
renommage = {
    'T1'     : 'temperature_moteur1_celsius',
    'Temp'   : 'temperature_huile_celsius',
    'temp_A' : 'temperature_ambiante_celsius',
    'P_ref'  : 'pression_reference_bar',
}
df = df.rename(columns=renommage)

# Convertir les unités si nécessaire
if 'temperature_echappement_fahrenheit' in df.columns:
    df['temperature_echappement_celsius'] = (
        (df['temperature_echappement_fahrenheit'] - 32) * 5 / 9
    )
    df = df.drop(columns=['temperature_echappement_fahrenheit'])
The rule to remember: each column must have its own unit in its own name. Not temperature — temperature_celsius. Just five seconds of rigor when naming saves hours of debugging.
Problem 5 — The lack of documentation
It is the invisible error, the one that doesn’t cause immediate suffering, yet comes at the highest cost in the long run.
What exactly does this sensor measure? How frequently? Since when? Why is there a sudden jump on March 14? Recalibration, replacement or a genuine anomaly? Regarding the filter project, no one had documented the fact that the filter might have been changed outside the maintenance schedule by an emergency technician who noted the replacement in a paper log rather than in the software system. Had this information been documented, it would have saved us weeks of investigation.
import json

# Template de documentation à mettre en tête de chaque script
METADATA = {
    'fichier_source'    : 'mesures_filtre_encrassage_2024.csv',
    'date_export'       : '2024-03-15',
    'systeme_origine'   : 'SCADA Schneider v3.2',
    'frequence'         : '1 mesure par minute',
    'responsable'       : 'Bureau méthodes — poste 4421',
    'colonnes'          : {
        'timestamp'     : 'Horodatage UTC, format ISO 8601',
        'courant_a'     : 'Consommation pompe, Ampères, capteur Hall',
        'pression_bar'  : 'Pression différentielle filtre, bar',
        'statut'        : '0=normal, 1=alarme, 2=hors service',
    },
    'anomalies_connues' : [
        '2024-01-15 : trou de 3 mois — cause inconnue, en cours investigation',
        '2024-03-10 : filtre changé hors GMAO par équipe nuit',
        '2024-03-14 : recalibrage capteur courant_a',
    ],
}

print(json.dumps(METADATA, indent=2, ensure_ascii=False))
The rule to remember : document things while you still know them. In six months, you will have forgotten. And the person taking over the project will waste a week piecing together what took you five minutes to jot down.
The 3-step method for tidying up a dataset
Rather than dealing with issues as they arise, here is the method I systematically apply to any new dataset.
Step 1 — Audit : know where you stand before touching anything
import pandas as pd

def audit_dataset(df, nom_fichier=""):
    """
    Audit rapide à lancer sur tout nouveau dataset.
    À appeler avant toute transformation.
    """
    print(f"{'='*50}")
    print(f"AUDIT : {nom_fichier}")
    print(f"{'='*50}n")

    print(f"Dimensions       : {df.shape[0]:,} lignes × {df.shape[1]} colonnes")

    print(f"n── Types de colonnes ──")
    print(df.dtypes)

    print(f"n── Valeurs manquantes ──")
    manquants = df.isnull().sum()
    manquants_pct = (manquants / len(df) * 100).round(1)
    rapport = pd.DataFrame({'count': manquants, '%': manquants_pct})
    print(rapport[rapport['count'] > 0])

    print(f"n── Doublons ──")
    print(f"{df.duplicated().sum()} lignes dupliquées")

    print(f"n── Aperçu statistique ──")
    print(df.describe().round(2))

    print(f"n── Premières lignes ──")
    print(df.head(3))

# Utilisation — à appeler sur chaque nouveau fichier
df = pd.read_csv('votre_fichier.csv', sep=';')
audit_dataset(df, nom_fichier='votre_fichier.csv')
Step 2 — Cleaning: correct in order
def nettoyer_dataset(df):
    """
    Pipeline de nettoyage standard.
    À adapter selon les résultats de l'audit.
    """
    df = df.copy()  # ne jamais modifier le dataset original

    # 1. Supprimer les lignes et colonnes vides
    df = df.dropna(how='all').dropna(axis=1, how='all')

    # 2. Nettoyer les chaînes de caractères
    cols_texte = df.select_dtypes(include='object').columns
    for col in cols_texte:
        df[col] = (df[col].astype(str)
                   .str.strip()
                   .str.replace('n', ' ', regex=False)
                   .str.replace('xa0', '', regex=False)
                   .replace('nan', pd.NA))

    # 3. Supprimer les doublons
    df = df.drop_duplicates()

    return df

df_propre = nettoyer_dataset(df)
Step 3 — Documentation: noting what was done and why
import json
from datetime import date

# Sauvegarder le fichier nettoyé séparément
# Ne jamais écraser le fichier source
df_propre.to_csv('votre_fichier_nettoye.csv',
                  sep=';', index=False, encoding='utf-8-sig')

# Log des transformations
LOG_NETTOYAGE = {
    'date'             : str(date.today()),
    'fichier_source'   : 'votre_fichier.csv',
    'fichier_sortie'   : 'votre_fichier_nettoye.csv',
    'transformations'  : [
        'Suppression 3 lignes vides',
        'Correction format date colonne timestamp (texte → datetime)',
        'Correction séparateur décimal colonne mesure (, → .)',
        'Suppression 12 doublons',
    ],
    'anomalies_notees' : [
        'Trou de 47 jours entre le 2024-01-15 et le 2024-03-03 — cause inconnue',
    ],
}

print(json.dumps(LOG_NETTOYAGE, indent=2, ensure_ascii=False))
Key takeaways
These 5 families of problems have one thing in common: they are all silent. They don’t crash your code. They produce results that look normal but are wrong.
The most effective defense is a systematic audit before each analysis. Not because it’s rigorous on paper but because it saves you time. An hour of auditing often saves a week of debugging.
And if you remember just one thing: understand your data before calculating it. Where they come from, how they were collected, what may have happened between the measurement and the file you have in hand. It is this understanding, not the algorithm, that makes the difference between a successful project and one that ends up in a drawer.
💬 What is the problem of data quality cost you the most time on a real project ? Tell me in comment.
📩 I am preparing a comprehensive course on applied industrial data science.
Leave a Reply